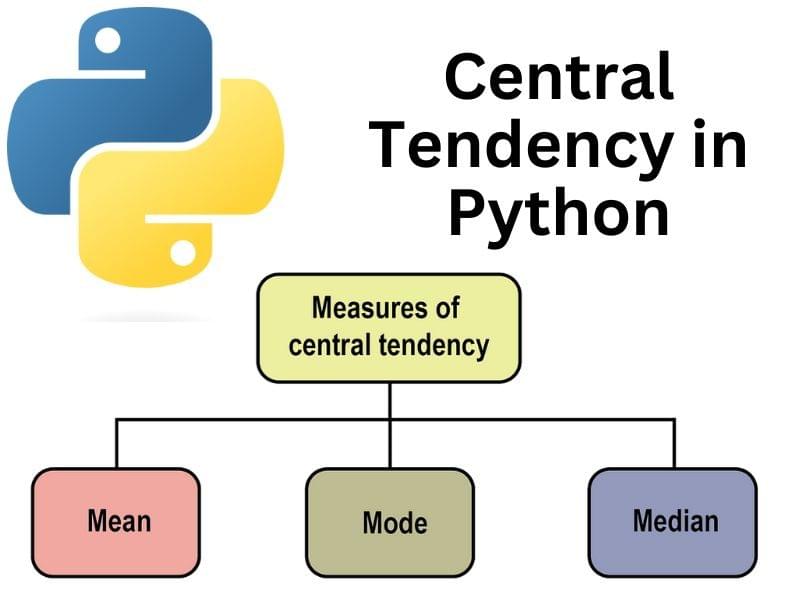
When it comes to analyzing data, one of the most important concepts to understand is central tendency. Central tendency refers to the measure of the center or average of a distribution. In Python, there are several methods and functions available to calculate central tendency, each with its own strengths and use cases. In this guide, we will explore the different measures of central tendency and how to implement them in Python.
Mean: The Most Common Measure
The mean is perhaps the most commonly used measure of central tendency. It is calculated by summing up all the values in a dataset and dividing it by the number of values. In Python Programming, the mean can be easily calculated using the mean() function from the statistics module.
For example, let's say we have a list of numbers representing the ages of a group of people:
ages = [25, 30, 35, 40, 45]
To calculate the mean age, we can use the following code:
import statistics
mean_age = statistics.mean(ages)
print(mean_age)
The output will be:
35
So, the mean age of the group is 35.
Median: The Middle Ground
The median is another measure of central tendency that is often used, especially when dealing with skewed data. The median is the middle value in a sorted dataset. If there is an even number of values, the median is the average of the two middle values. In Python, the median can be calculated using the median() function from the statistics module.
Let's consider the same list of ages:
ages = [25, 30, 35, 40, 45]
To calculate the median age, we can use the following code:
import statistics
median_age = statistics.median(ages)
print(median_age)
The output will be:
35
Again, the median age is 35, which is the middle value in the sorted list.
Mode: The Most Frequent Value
The mode is another measure of central tendency that represents the most frequently occurring value in a dataset. In Python, the mode can be calculated using the mode() function from the statistics module.
Let's consider a different example, where we have a list of numbers representing the test scores of a group of students:
scores = [85, 90, 95, 90, 80, 85]
To calculate the mode score, we can use the following code:
import statistics
mode_score = statistics.mode(scores)
print(mode_score)
The output will be:
90
So, the mode score is 90, which is the most frequently occurring value in the list.
Other Measures of Central Tendency
In addition to the mean, median, and mode, there are other measures of central tendency that can be useful in different scenarios. Some of these measures include:
Weighted Mean: Calculates the mean by assigning different weights to different values.- Geometric Mean: Calculates the mean of a set of positive numbers by taking the nth root of the product of the numbers.
- Harmonic Mean: Calculates the mean of a set of numbers by taking the reciprocal of the arithmetic mean of their reciprocals.
Python provides various libraries and functions to calculate these measures of central tendency. For example, the numpy library provides the average() function to calculate the weighted mean, and the scipy library provides the gmean() function to calculate the geometric mean.
Conclusion
Understanding central tendency is crucial for analyzing and interpreting data. In this guide, we explored the different measures of central tendency, including the mean, median, and mode, and how to calculate them using Python. Remember that each measure has its own strengths and use cases, so it's important to choose the appropriate measure based on the nature of your data and the insights you want to gain. Happy analyzing!